پرونده:Ensemble quantum 1DOF canonical.png

پروندهٔ اصلی (۹۰۰ × ۹۰۰ پیکسل، اندازهٔ پرونده: ۷۸ کیلوبایت، نوع MIME پرونده: image/png)
این پرونده در ویکیانبار موجود است. محتویات صفحهٔ توصیف آن در زیر نمایش داده میشود. |
خلاصه
| توضیحEnsemble quantum 1DOF canonical.png |
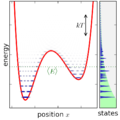
English: Ensemble canonically distributed over energy, for a quantum system consisting of one particle in a potential well. |
| تاریخ | |
| منبع | اثر شخصی |
| پدیدآور | Nanite |
Source
Python source code. Requires matplotlib.
from pylab import *

figformat = '.png'
saveopts = {'dpi':300} #, 'bbox_inches':'tight', 'transparent':True, 'frameon':True}
seterr(divide='ignore')

# Very important number, smaller means more classical (finer-spaced discrete levels, larger means more quantum (fewer discrete levels)
hbar = 0.7/(2*pi)

temp_canonical = 4.1
energy_microcanonical = -2.0
range_microcanonical = 1.0
micro_e0 = energy_microcanonical - 0.5*range_microcanonical
micro_e1 = energy_microcanonical + 0.5*range_microcanonical
def potential(x):
    return x**6 + 4*x**3 - 5*x**2 - 4*x
x = linspace(-2.5,2.5,1001)
dx = x[1] - x[0]
U = potential(x)
mass = 1.0

# compute pixel edges, used for pcolormesh.
xcorners = zeros(len(x)+1)
xcorners[:len(x)] = x-0.5*dx
xcorners[-1] = x[-1] + 0.5*dx

# make an energy range, for plots vs energy.
E = linspace(-20,20,10001)

#define color map that is transparent for low values, and dark blue for high values.
# weighted to show low probabilities well
cdic = {'red':   [(0,0,0),(1,0,0)],
        'green': [(0,0,0),(1,0,0)],
        'blue':  [(0,0.7,0.7),(1,0.7,0.7)],
        'alpha': [(0,0,0),
                  (0.1,0.4,0.4),
                  (0.2,0.6,0.6),
                  (0.4,0.8,0.8),
                  (0.6,0.9,0.9),
                  (1,1,1)]}
cm_prob = matplotlib.colors.LinearSegmentedColormap('prob',cdic)

# To get eigenvalues, we need to set up a NxN matrix for the
# Schrodinger equation Hamiltonian. For the momentum operator
# (-hbar^2/(2*m) * d^2/dx^2) the typical central difference
# approximation will be used.
H = zeros((len(x),len(x)))
# set diagonal
H.ravel()[0::len(x)+1] = hbar*hbar/(mass*dx*dx)
H.ravel()[0::len(x)+1] += U
# set above and below diagonal
H.ravel()[1::len(x)+1] = -0.5*hbar*hbar/(mass*dx*dx)
H.ravel()[len(x)::len(x)+1] = -0.5*hbar*hbar/(mass*dx*dx)

# Right, the hamiltonian is set up, so let's just go ahead and
# diagonalize it, poink.
eigval, eigvec = eigh(H)

def doev(H, Emax):
    lowE_idx = find(eigval<Emax)
    figure()
    for i in lowE_idx:
        plot(x,eigvec[:,i], label='E = '+str(eigval[i]))
    legend(fontsize=8)

micro = ((eigval > micro_e0)*(eigval < micro_e1))*1.0
print "microcanonical (E0 =",energy_microcanonical,", Delta =",0.5*range_microcanonical,") avg energy",
print sum(eigval*micro)/sum(micro)

canonical = exp(-eigval/temp_canonical)
canonical_avgE = sum(eigval*canonical)/sum(canonical)
print "canonical (T =",temp_canonical,") avg energy",
print canonical_avgE

# Boring level plot
fig = figure()
ax = axes()
plot(x,potential(x), linewidth=3)
for i in find(eigval<=13):
    axhline(eigval[i], color=(0.5,0.5,0.5),linewidth=0.5,zorder=-1)
ylim(-8,9)
xlim(-2.1,1.7)
fig.get_axes()[0].xaxis.set_ticks([-2,-1,0,1])
xlabel("position $x$")
ylabel("potential $U(x)$")
fig.set_size_inches(3,3)
fig.patch.set_alpha(0)
savefig("quant_potential_eigval_lines"+figformat, **saveopts)

def levelplot(weights):
    """
    Plot the potential with eigenstates' wavefunctions superimposed (shown).
      weights: list fractions to multiply each eigenstate probability
               (e.g., weight 0: do not show. weight 1: fully show)
      name: filename to save to
    """

    fig = figure()
    ax = axes([0.08,0.1,0.73,0.89]) #([0.125,0.1,0.71,0.8])
    plot(x,potential(x), linewidth=2, color='r', zorder=-1)
    maxp = dx*3.5*amax(weights)
    eigwidth = 0.2
    for i in find(eigval<=9):
        # Here, we plot the eigenfunctions as horizontal bars of varying darkness,
        # with height set by the energy eigenvalue.
        if weights[i] == 0: continue # don't plot levels with zero weight
        pdist = eigvec[:,i]**2 * weights[i]
        pdist.shape = (1,len(x))
        extent = (amin(x)-0.5*dx, amax(x)+0.5*dx, eigval[i]-0.5*eigwidth, eigval[i]+0.5*eigwidth)
        img = imshow(vstack((pdist,pdist)), cmap=cm_prob, extent=extent, interpolation='none', aspect='auto')
#        Alternate code using pcolormesh doesn't work because of ugly edges.
#        ycorners = vstack([
#            [eigval[i]-0.5*eigwidth]*(len(x)+1),
#            [eigval[i]+0.5*eigwidth]*(len(x)+1) ])
#        pcolormesh(vstack([xcorners,xcorners]), ycorners, pdist, cmap=cm_prob)
        clim(0,maxp)

    ylim(-9,9)
    xlim(-2.1,1.7)
    fig.get_axes()[0].xaxis.set_ticks([-2,-1,0,1])
    ax.xaxis.set_ticklabels([])
    ax.yaxis.set_ticklabels([])
    ax.xaxis.labelpad = 2
    ax.yaxis.labelpad = -3
    xlabel("position $x$")
    ylabel("energy")

    ax = axes([0.83,0.1,0.14,0.89], axisbg=(0.95,0.95,0.95))
    ax.xaxis.set_ticks([])
    ax.yaxis.set_ticklabels([])
    ax.yaxis.set_ticks_position('right')
    ylim(-9,9)
    xlabel("states")
    dos = E*0.0
    for i,Elevel in enumerate(eigval):
        # Here we sum up the density of states function
        if Elevel > 20: continue # don't waste time with high levels
        dos += exp(-4*((E-Elevel)/eigwidth)**2) * weights[i]
    fill_betweenx(E, dos, linewidth=0, color=(0.2,0.2,0.76))
    xlim(-0.05*max(dos),max(dos)*1.1)

    fig.set_size_inches(3,3)
    fig.patch.set_alpha(0)

levelplot(ones(len(eigval)))
savefig("quant_potential_eigval_pdists"+figformat, **saveopts)

levelplot(micro)
sca(gcf().axes[0])
axhspan(micro_e0, micro_e1, color=(0.7,1,0.7),zorder=-2)
sca(gcf().axes[1])
axhspan(micro_e0, micro_e1, color=(0.7,1,0.7),zorder=-2)
savefig("quant_potential_eigval_pdists_micro"+figformat, **saveopts)

levelplot(canonical)
sca(gcf().axes[0])
annotate("$\\langle E\\rangle$", (-0.5,canonical_avgE),
    textcoords=None,verticalalignment='top',color=(0,0.4,0))
axhline(canonical_avgE, linestyle='dotted', linewidth=1,color=(0,0.4,0))
annotate('',(1.2,7.-temp_canonical),(1.2,7.),
    arrowprops = {'arrowstyle':'<->'})
text(1.15,7.-0.5*temp_canonical,'$kT$',
    horizontalalignment='right',verticalalignment='center')
sca(gcf().axes[1])
axhline(canonical_avgE, linestyle='dotted', linewidth=1,color=(0,0.4,0))
fill_betweenx(E, exp(-E/temp_canonical), linewidth=0, color=(0.7,1,0.7),zorder=-2) # green exponential
savefig("quant_potential_eigval_pdists_canonical"+figformat, **saveopts)

# Position expectation values
figure()
pdist = zeros(len(x))
for i,p in enumerate(micro): pdist += p*eigvec[:,i]**2
if any(micro):
    plot(x, pdist/sum(micro)/dx, label='microcanonical')
pdist = zeros(len(x))
for i,p in enumerate(canonical): pdist += p*eigvec[:,i]**2
plot(x, pdist/sum(canonical)/dx, label='canonical', color='g')
xlim(-2.1,1.7)
fig.get_axes()[0].xaxis.set_ticks([-2,-1,0,1])
xlabel("position $x$")
ylabel("PDF of position $P(x)$")
legend()
savefig("quant_position_pdf"+figformat, **saveopts)
اجازهنامه
| این پرونده تحت CC0 1.0 Universal Public Domain Dedication کریتیو کامنز قابل دسترسی است. | |
| کسی که اثری را با این سند همراه کرده است، با چشمپوشی از تمام حقوق خود نسبت به اثر در جهان تحت قانون کپیرایت و همهٔ حقوق قانونی مرتبط یا همسایهای که او در اثر داشته است، تا حد مجاز در قانون، آن را به مالکیت عمومی اهدا کرده است. شما میتوانید بدون گرفتن اجازه این اثر را تکثیر کنید، تغییر دهید، منتشر کنید یا دوباره ایجاد کنید، حتی اگر مقاصد تجاری داشته باشید.
http://creativecommons.org/publicdomain/zero/1.0/deed.enCC0Creative Commons Zero, Public Domain Dedicationfalsefalse |
عنوان
آیتمهایی که در این پرونده نمایش داده شدهاند
توصیفها
این خصوصیت مقداری دارد اما نامشخص است.
۳۰ اکتبر 2013
source of file انگلیسی
original creation by uploader انگلیسی
تاریخچهٔ پرونده
روی تاریخ/زمانها کلیک کنید تا نسخهٔ مربوط به آن هنگام را ببینید.
| تاریخ/زمان | بندانگشتی | ابعاد | کاربر | توضیح | |
|---|---|---|---|---|---|
| کنونی | ۳۰ اکتبر ۲۰۱۳، ساعت ۲۱:۵۱ |  | ۹۰۰ در ۹۰۰ (۷۸ کیلوبایت) | Nanite | User created page with UploadWizard |
کاربرد پرونده
صفحهٔ زیر از این تصویر استفاده میکند:
کاربرد سراسری پرونده
ویکیهای دیگر زیر از این پرونده استفاده میکنند:
- کاربرد در en.wikipedia.org
- کاربرد در fr.wikipedia.org
فراداده
این پرونده حاوی اطلاعات اضافهایست که احتمالاً دوربین دیجیتال یا پویشگری که در ایجاد یا دیجیتالی کردن آن به کار رفته آن را افزوده است. اگر پرونده از وضعیت ابتداییاش تغییر داده شده باشد آنگاه ممکن است شرح و تفصیلات موجود اطلاعات تصویر را تماماً بازتاب ندهد.
| تفکیکپذیری افقی | ۱۱۸٫۱۱ نقطه در سانتیمتر |
|---|---|
| تفکیکپذیری عمودی | ۱۱۸٫۱۱ نقطه در سانتیمتر |
